Basics of Higgs boson production and decay
According to the Standard Model, Higgs Boson production is dominated by 2 process:
- gluon fusion process: gg → H
- vector boson fusion process: qq’ → qq’H (the original and final qq’ may be different)
Gluon fusion process is abbreviated as “ggF”, and vector boson fusion process is abbreviated as “VBF”. There are 5 other production processes which play a minor role, as their cross sections are smaller, but they are included in the analysis of this study.
As for Higgs boson decay modes, LHC is expected to be most sensitive to the following decays:
- H → γγ (you may remember that this mode is also present above)
- H → ZZ*
- H → WW*
- H → ττ
- H → bb
They together account for 88% of all Higgs boson decay. Other decays were also included in the analysis. The analysis of individual results were taken care by other groups, which are not the major interest here. We are interested in how to combine them to obtain a more meaningful result.
In the following, the signal strength parameter “μ” is defined as the ratio between the measured Higgs boson yield and its Standard Model expectation:
μ = σBR / (σBR)SM
That is, if the Standard Model is correct, we would expect this number to be close to 1, otherwise it would be larger. For a specific Higgs production and decay channel, such as i → H → f, we label the parameter “μ” as μif.
Decay — individual results combined
There are many interesting techniques which can select different decay events, including neural network (coming from AI — Artificial Intelligence) and binary decision tree (BDT) (from machine learning, also related to AI). It would be too lengthy to go through each one here, and you may go to find this for your interest. Let’s jump to the key analysis — combining the individual analyses.
Here are the individual analyses taken directly from other papers:
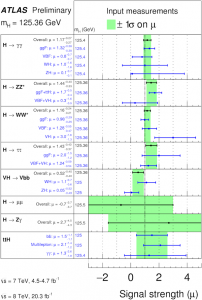
Each row represents a Higgs boson interaction channel, while each might come from a variety of Higgs production (indicated by sub-row). On the right, for each process i → H → f, the corresponding μif is plotted with its uncertainty. As a reminder, the closer μ to 1, the better Standard Model is working. In other words, if a bar on the plot doesn’t cover the central dotted horizontal line, it may indicate the presence of new physics. The μs for each row were combined to an overall μ (black bar). As you might have noticed, the Standard Model works quite well, but each μ has a large uncertainty. Could we do better? Here are the results of a combined analysis, with some rows combined into one row (the VH and ttH interactions above are combined to H → bb.
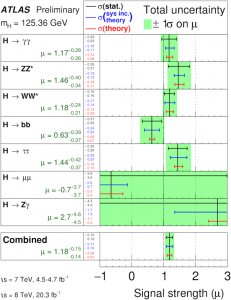
The horizontal scale is zoomed in. If you can imagine zooming it out, the two plots of each row are almost identical. What is the most important is the bottom row, which is the combined result. This is a plot of “global μ”, the global signal strength resulting from some statistical techniques. The essence is the same: the Standard Model predicts this value to be 1, and we want to narrow down its uncertainty. As you can see, the uncertainty (bar width) is much lower than individual result, while the central dotted line lies not far away from 1σ. It indicates Standard Model is valid (technically, the result is consistent with Standard Model with a p-value of 18%.)
Production — individual results combined
Here Higgs Boson production processes are characterized into 2 groups:
- fermion-mediated (denoted by ggF + ttH)
- boson-mediated (denoted by VBF + VH)
Therefore, μfggF + ttH means: “The signal strength of the process ‘fermion-mediated production of Higgs boson, followed by a decay to f.’”
Now, the meaning of μfVBF + VH should be obvious.
We used these parameters to test the Standard Model. As always, the Standard Model expects both to be 1. If we plot one of them as the y-axis, another as the x-axis, it will appear as a dot (presumably close to (1,1)). Their uncertainty together will form a surrounding oval.
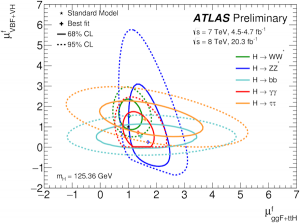
As shown, the result is consistent will the Standard Model.
Detailed analysis shows strong evidence for VBF production of the Higgs boson, with a 4.3σ level of significance.
Coupling strengths of Higgs boson to fermion and vector boson
Coupling strength is an indicator of how strongly the Higgs boson interacts with a specific particle. Skipping the analyses, let’s see the result of our study: the strength of several coupling strengths were determined precisely with an uncertainty of the order of 10%, and no significant deviation from the standard Model was observed.
Conclusion
The observed data are found to be compatible with the Standard Model’s expectations for a Higgs boson at a mass of 125.36GeV for all models considered.
References
- our ATLAS note: Study of the spin and parity of the Higgs boson in di-boson decays with the ATLAS detector
- our ATLAS note: Measurements of the Higgs boson production and decay rates and coupling strengths with ATLAS
- Evidence for the spin-0 nature of the Higgs boson using ATLAS data, arXiv:1307.1432
- A Framewrok of Higgs Characterisation, arXiv:1306.6464
- Combined Measurement of the Higgs Boson Mass in pp Collisions at √s=7 and 8 TeV with the ATLAS and CMS Experiments