Study of the spin, parity and Lagrangian tensor structure of the Higgs boson
This study aims to test the Standard Model prediction against alternative models by studying the JCP quantum number of Higgs boson (again, the physical meaning of this symbol is not important here). The Standard Model predicts this quantum number to be 0++. More often, it is described as JP = 0+, with C skipped. This hypothesis has been tested previously by the ATLAS Collaboration in 2013 (1st reference below). They have excluded other models (such as JP = 1–) with a confidence level of over 97.8%.
Our study complements their result, by taking advantage of improvements in alternative spin hypothesis. Our results exclude alternative hypothesis at more than 99% cofidence level. Moreover, instead of fixed JP , we also investigated in mixed terms (technically, Higgs boson is not a CP eigenstate).
Method of the Study
The Standard Model’s hypothesis for the spin-parity JP of the Higgs boson was tested by studying the decay channels of Higgs boson produced in the LHC experiment. It was assumed to be many different numbers, and then used computer to simulate decay events for each scenario. A comparison of the generated result with experimental data would point out the validity of the assumed JP.
As mentioned above, this study takes advantage of recent improvements to the modeling of spin hypothesis (arxiv:1306.6464), based on effective field theory (EFT), for which the technical details would be skipped here. For a fixed spin hypothesis, we took 3 alternative hypothesis for JP:
- 2 (spin 2)
- 0h+ (BSM spin-0 CP-even, the subscript h differentiate it from Standard Model hypothesis)
- 0– (BSM spin-0 CP-odd)
The studied decay modes are as follows (H represents Higgs boson):
- H → γγ
- H → ZZ* → 4l (l is lepton)
- H → WW*
The latter 2 decays are collectively described as HVV decay. For the mixed CP hypothesis, BSM terms were assumed to be present in the decay. The HVV decay was described as containing both CP-odd and CP-even terms. The relative fraction of each term is studied.
As usual, the background events are considered (those events which are not related Higgs Boson, but yield similar decay product). They are included in the computer simulation.
Analysis and result
Fixed CP
Events from LHC and ATLAS were selected according to the product of above 3 decay modes. For example, for H → γγ a diphoton trigger was imposed. That is to say, if 2 photons passed detection, which exceed a certain threshold momentum and meet some other criteria, that was taken to be an event (no clues on whether it is a Higgs event or background). For brevity, only the H → γγ decay analysis with spin-2 hypothesis will be described here, while other analysis have a similar framework.
After the diphoton trigger selection, we got 17220 events selected for the 7TeV LHC experiment, and 94540 events for the 8TeV experiment. In order to perform better analysis, the selected diphoton events were classified according to their transverse momentum, and another value |cos θ| (the meaning is not important here). By this scheme, the events were classified in to 11 classes, named C1, C2, etc…
The following plot shows the number fraction of diphoton events (both simulated and detected) against those classes. The spin-2 hypothesis is modeled with 3 different κq parameter in this plot, which represents QCD coupling strength. You may simply treat the 3 plots as different models under spin-2 hypothesis.
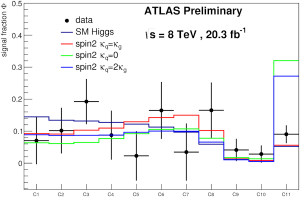
The red green blue lines represent simulated events with spin-2 hypothesis, and the dark blue line comes from Standard Model hypothesis. Black dots represent experimental data, with experimental uncertainty shown as +. If the line given by a hypothesis lies within the +, it shows good matches with experiment. Otherwise, it could be rejected at a certain confidence level. The C11 class is especially meaningful here, because the green and blue lines are far away from experimental data, and may be considered “rejected”. For the red line, it does not match experiment for the C5 and C7 classes, though not very far away. It shows that the dark blue line matches experiment the best, which is our familiar the Standard Model.
A single analysis is good, but not enough. The results from different decay modes are combined, and a detailed statistical analysis is performed. All alternative hypothesis are excluded at more than 99% confidence level in favor of Standard Model.
Mixed CP
The analysis for the mixed CP scenario is slightly different, because a variable range of mixing of CP-odd and CP-even terms may be set, under the spin-0 hypothesis. Such “degree of mixing CP quantum number” is quantified by a “mixing angle α”. The equation is quite complicated, but the meaning of α is easy to understand: if α is 0 or 180 degrees, there is no mixing. You may consider the CP terms as 2 plates, and α is the angle between them. If the angle is 0 or 180 degrees, one plate completely covers the other, so there is only one observable plate — no mixing. The model of HVV interaction is further parameterized with 3 other parameters. Therefore, it is difficult to simply reject or accept the hypothesis. We can only reject a certain range of parameters. The Standard Model hypothesis falls within this range.
For the detailed result, please refer to our ATLAS note.